This data includes health information of 101,766 patient encounters across 130 different U.S. Hospitals. One of the main reasons for the development of the database is to determine what is the connection, if any, between the rates of diabetes in patients and the rates of hospital readmissions in patients. Among other insights, this analysis finds that prevalence of diabetes diagnoses in patients correlates with prevalence of hospital readmissions.
1) To help me explore the data I returned all columns

SQL Healthcare Result Set 1
| encounter_id | patient_nbr | race | gender | age | weight | admission_type_id | discharge_disposition_id | admission_source_id | time_in_hospital | payer_code | medical_specialty | num_lab_procedures | num_procedures | num_medications | number_outpatient | number_emergency | number_inpatient | diag_1 | diag_2 | diag_3 | number_diagnoses | max_glu_serum | A1Cresult | metformin | repaglinide | nateglinide | chlorpropamide | glimepiride | acetohexamide | glipizide | glyburide | tolbutamide | pioglitazone | rosiglitazone | acarbose | miglitol | troglitazone | tolazamide | examide | citoglipton | insulin | glyburide-metformin | glipizide-metformin | glimepiride-pioglitazone | metformin-rosiglitazone | metformin-pioglitazone | change | diabetesMed | readmitted |
|---|---|---|---|---|---|---|---|---|---|---|---|---|---|---|---|---|---|---|---|---|---|---|---|---|---|---|---|---|---|---|---|---|---|---|---|---|---|---|---|---|---|---|---|---|---|---|---|---|---|
| 2,278,392 | 8,222,157 | Caucasian | Female | [0-10) | ? | 6 | 25 | 1 | 1 | ? | Pediatrics-Endocrinology | 41 | 0 | 1 | 0 | 0 | 0 | 250.83 | ? | ? | 1 | None | None | No | No | No | No | No | No | No | No | No | No | No | No | No | No | No | No | No | No | No | No | No | No | No | No | No | NO |
| 149,190 | 55,629,189 | Caucasian | Female | [10-20) | ? | 1 | 1 | 7 | 3 | ? | ? | 59 | 0 | 18 | 0 | 0 | 0 | 276 | 250.01 | 255 | 9 | None | None | No | No | No | No | No | No | No | No | No | No | No | No | No | No | No | No | No | Up | No | No | No | No | No | Ch | Yes | >30 |
| 64,410 | 86,047,875 | AfricanAmerican | Female | [20-30) | ? | 1 | 1 | 7 | 2 | ? | ? | 11 | 5 | 13 | 2 | 0 | 1 | 648 | 250 | V27 | 6 | None | None | No | No | No | No | No | No | Steady | No | No | No | No | No | No | No | No | No | No | No | No | No | No | No | No | No | Yes | NO |
| 500,364 | 82,442,376 | Caucasian | Male | [30-40) | ? | 1 | 1 | 7 | 2 | ? | ? | 44 | 1 | 16 | 0 | 0 | 0 | 8 | 250.43 | 403 | 7 | None | None | No | No | No | No | No | No | No | No | No | No | No | No | No | No | No | No | No | Up | No | No | No | No | No | Ch | Yes | NO |
| 16,680 | 42,519,267 | Caucasian | Male | [40-50) | ? | 1 | 1 | 7 | 1 | ? | ? | 51 | 0 | 8 | 0 | 0 | 0 | 197 | 157 | 250 | 5 | None | None | No | No | No | No | No | No | Steady | No | No | No | No | No | No | No | No | No | No | Steady | No | No | No | No | No | Ch | Yes | NO |
| 35,754 | 82,637,451 | Caucasian | Male | [50-60) | ? | 2 | 1 | 2 | 3 | ? | ? | 31 | 6 | 16 | 0 | 0 | 0 | 414 | 411 | 250 | 9 | None | None | No | No | No | No | No | No | No | No | No | No | No | No | No | No | No | No | No | Steady | No | No | No | No | No | No | Yes | >30 |
| 55,842 | 84,259,809 | Caucasian | Male | [60-70) | ? | 3 | 1 | 2 | 4 | ? | ? | 70 | 1 | 21 | 0 | 0 | 0 | 414 | 411 | V45 | 7 | None | None | Steady | No | No | No | Steady | No | No | No | No | No | No | No | No | No | No | No | No | Steady | No | No | No | No | No | Ch | Yes | NO |
| 63,768 | 114,882,984 | Caucasian | Male | [70-80) | ? | 1 | 1 | 7 | 5 | ? | ? | 73 | 0 | 12 | 0 | 0 | 0 | 428 | 492 | 250 | 8 | None | None | No | No | No | No | No | No | No | Steady | No | No | No | No | No | No | No | No | No | No | No | No | No | No | No | No | Yes | >30 |
| 12,522 | 48,330,783 | Caucasian | Female | [80-90) | ? | 2 | 1 | 4 | 13 | ? | ? | 68 | 2 | 28 | 0 | 0 | 0 | 398 | 427 | 38 | 8 | None | None | No | No | No | No | No | No | Steady | No | No | No | No | No | No | No | No | No | No | Steady | No | No | No | No | No | Ch | Yes | NO |
| 15,738 | 63,555,939 | Caucasian | Female | [90-100) | ? | 3 | 3 | 4 | 12 | ? | InternalMedicine | 33 | 3 | 18 | 0 | 0 | 0 | 434 | 198 | 486 | 8 | None | None | No | No | No | No | No | No | No | No | No | No | Steady | No | No | No | No | No | No | Steady | No | No | No | No | No | Ch | Yes | NO |
| 28,236 | 89,869,032 | AfricanAmerican | Female | [40-50) | ? | 1 | 1 | 7 | 9 | ? | ? | 47 | 2 | 17 | 0 | 0 | 0 | 250.7 | 403 | 996 | 9 | None | None | No | No | No | No | No | No | No | No | No | No | No | No | No | No | No | No | No | Steady | No | No | No | No | No | No | Yes | >30 |
| 36,900 | 77,391,171 | AfricanAmerican | Male | [60-70) | ? | 2 | 1 | 4 | 7 | ? | ? | 62 | 0 | 11 | 0 | 0 | 0 | 157 | 288 | 197 | 7 | None | None | No | No | No | No | No | No | No | Up | No | No | No | No | No | No | No | No | No | Steady | No | No | No | No | No | Ch | Yes | <30 |
| 40,926 | 85,504,905 | Caucasian | Female | [40-50) | ? | 1 | 3 | 7 | 7 | ? | Family/GeneralPractice | 60 | 0 | 15 | 0 | 1 | 0 | 428 | 250.43 | 250.6 | 8 | None | None | Steady | Up | No | No | No | No | No | No | No | No | No | No | No | No | No | No | No | Down | No | No | No | No | No | Ch | Yes | <30 |
| 42,570 | 77,586,282 | Caucasian | Male | [80-90) | ? | 1 | 6 | 7 | 10 | ? | Family/GeneralPractice | 55 | 1 | 31 | 0 | 0 | 0 | 428 | 411 | 427 | 8 | None | None | No | No | No | No | No | No | No | No | No | No | No | No | No | No | No | No | No | Steady | No | No | No | No | No | No | Yes | NO |
| 62,256 | 49,726,791 | AfricanAmerican | Female | [60-70) | ? | 3 | 1 | 2 | 1 | ? | ? | 49 | 5 | 2 | 0 | 0 | 0 | 518 | 998 | 627 | 8 | None | None | No | No | No | No | No | No | No | No | No | No | No | No | No | No | No | No | No | Steady | No | No | No | No | No | No | Yes | >30 |
| 73,578 | 86,328,819 | AfricanAmerican | Male | [60-70) | ? | 1 | 3 | 7 | 12 | ? | ? | 75 | 5 | 13 | 0 | 0 | 0 | 999 | 507 | 996 | 9 | None | None | No | No | No | No | No | No | No | No | No | No | No | No | No | No | No | No | No | Up | No | No | No | No | No | Ch | Yes | NO |
| 77,076 | 92,519,352 | AfricanAmerican | Male | [50-60) | ? | 1 | 1 | 7 | 4 | ? | ? | 45 | 4 | 17 | 0 | 0 | 0 | 410 | 411 | 414 | 8 | None | None | No | No | No | No | No | No | Steady | No | No | No | No | No | No | No | No | No | No | Steady | No | No | No | No | No | Ch | Yes | <30 |
| 84,222 | 108,662,661 | Caucasian | Female | [50-60) | ? | 1 | 1 | 7 | 3 | ? | Cardiology | 29 | 0 | 11 | 0 | 0 | 0 | 682 | 174 | 250 | 3 | None | None | No | No | No | No | No | No | No | Steady | No | No | No | No | No | No | No | No | No | No | No | No | No | No | No | No | Yes | NO |
| 89,682 | 107,389,323 | AfricanAmerican | Male | [70-80) | ? | 1 | 1 | 7 | 5 | ? | ? | 35 | 5 | 23 | 0 | 0 | 0 | 402 | 425 | 416 | 9 | None | None | No | No | No | No | No | No | No | No | No | No | No | No | No | No | No | No | No | Steady | No | No | No | No | No | No | Yes | >30 |
| 148,530 | 69,422,211 | ? | Male | [70-80) | ? | 3 | 6 | 2 | 6 | ? | ? | 42 | 2 | 23 | 0 | 0 | 0 | 737 | 427 | 714 | 8 | None | None | No | No | No | No | No | No | No | Down | No | No | No | No | No | No | No | No | No | Steady | No | No | No | No | No | Ch | Yes | NO |
| 150,006 | 22,864,131 | ? | Female | [50-60) | ? | 2 | 1 | 4 | 2 | ? | ? | 66 | 1 | 19 | 0 | 0 | 0 | 410 | 427 | 428 | 7 | None | None | No | No | No | No | No | No | No | No | No | No | No | No | No | No | No | No | No | Down | No | No | No | No | No | Ch | Yes | NO |
| 150,048 | 21,239,181 | ? | Male | [60-70) | ? | 2 | 1 | 4 | 2 | ? | ? | 36 | 2 | 11 | 0 | 0 | 0 | 572 | 456 | 427 | 6 | None | None | Steady | No | No | No | Steady | No | No | No | No | No | No | No | No | No | No | No | No | Steady | No | No | No | No | No | Ch | Yes | NO |
| 182,796 | 63,000,108 | AfricanAmerican | Female | [70-80) | ? | 2 | 1 | 4 | 2 | ? | ? | 47 | 0 | 12 | 0 | 0 | 0 | 410 | 401 | 582 | 8 | None | None | No | No | No | No | No | No | No | No | No | No | No | No | No | No | No | No | No | No | No | No | No | No | No | No | No | NO |
| 183,930 | 107,400,762 | Caucasian | Female | [80-90) | ? | 2 | 6 | 1 | 11 | ? | ? | 42 | 2 | 19 | 0 | 0 | 0 | V57 | 715 | V43 | 8 | None | None | No | No | No | No | No | No | No | No | No | No | No | No | No | No | No | No | No | No | No | No | No | No | No | No | No | >30 |
| 216,156 | 62,718,876 | AfricanAmerican | Female | [70-80) | ? | 3 | 1 | 2 | 3 | ? | ? | 19 | 4 | 18 | 0 | 0 | 0 | 189 | 496 | 427 | 6 | None | None | No | No | No | No | No | No | Steady | No | No | No | No | No | No | No | No | No | No | Steady | No | No | No | No | No | Ch | Yes | NO |
| 221,634 | 21,861,756 | Other | Female | [50-60) | ? | 1 | 1 | 7 | 1 | ? | ? | 33 | 0 | 7 | 0 | 0 | 0 | 786 | 401 | 250 | 3 | None | None | Steady | No | No | No | No | No | No | No | No | No | No | No | No | No | No | No | No | No | No | No | No | No | No | No | Yes | NO |
| 236,316 | 40,523,301 | Caucasian | Male | [80-90) | ? | 1 | 3 | 7 | 6 | ? | Cardiology | 64 | 3 | 18 | 0 | 0 | 0 | 427 | 428 | 414 | 7 | None | >7 | Steady | No | No | No | No | No | No | Steady | No | No | No | No | No | No | No | No | No | No | No | No | No | No | No | Ch | Yes | NO |
| 248,916 | 115,196,778 | Caucasian | Female | [50-60) | ? | 1 | 1 | 1 | 2 | ? | Surgery-General | 25 | 2 | 11 | 0 | 0 | 0 | 996 | 585 | 250.01 | 3 | None | None | No | No | No | No | No | No | No | No | No | No | No | No | No | No | No | No | No | Steady | No | No | No | No | No | No | Yes | >30 |
| 250,872 | 41,606,064 | Caucasian | Male | [20-30) | ? | 2 | 1 | 2 | 10 | ? | ? | 53 | 0 | 20 | 0 | 0 | 0 | 277 | 250.02 | 263 | 6 | None | None | No | No | No | No | No | No | No | No | No | No | No | No | No | No | No | No | No | Down | No | No | No | No | No | Ch | Yes | >30 |
| 252,822 | 18,196,434 | Caucasian | Female | [80-90) | ? | 1 | 2 | 7 | 5 | ? | Cardiology | 52 | 0 | 14 | 0 | 0 | 0 | 428 | 410 | 414 | 8 | None | None | Steady | No | No | No | No | No | No | Steady | No | No | No | No | No | No | No | No | No | No | No | No | No | No | No | Ch | Yes | >30 |
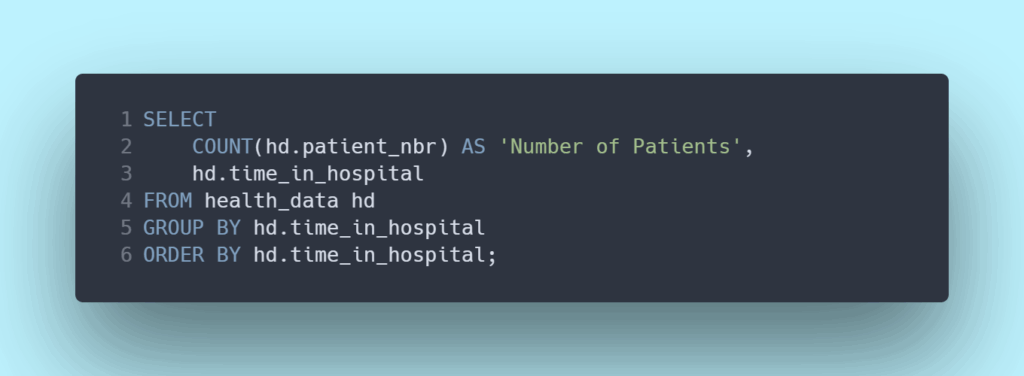
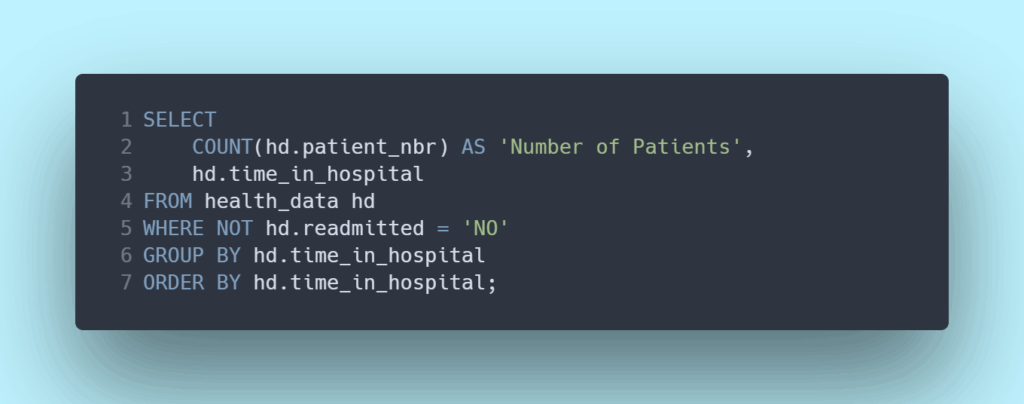
2) Since an important part of this data was hospital readmissions, I wanted to see first how long were most patients staying in the hospital. The first graph shows all hospital admissions while the second shows only hospital readmissions.
SQL Healthcare Result Set 2a
| Number of Patients | time_in_hospital |
|---|---|
| 14,208 | 1 days |
| 17,224 | 2 days |
| 17,756 | 3 days |
| 13,924 | 4 days |
| 9,966 | 5 days |
| 7,539 | 6 days |
| 5,859 | 7 days |
| 4,391 | 8 days |
| 3,002 | 9 days |
| 2,342 | 10 days |
| 1,855 | 11 days |
| 1,448 | 12 days |
| 1,210 | 13 days |
| 1,042 | 14 days |

SQL Healthcare Result Set 2b
| Number of Patients | time_in_hospital |
|---|---|
| 5,633 | 1 days |
| 7,631 | 2 days |
| 7,979 | 3 days |
| 6,708 | 4 days |
| 4,785 | 5 days |
| 3,704 | 6 days |
| 2,875 | 7 days |
| 2,214 | 8 days |
| 1,511 | 9 days |
| 1,174 | 10 days |
| 894 | 11 days |
| 711 | 12 days |
| 570 | 13 days |
| 513 | 14 days |

3) Because this analysis is exploring hospital admissions I wanted to see if there was any connection between the number of hospital procedures and the number of hospital admissions. We can see that a lower number of hospital procedures is more common than a higher number of hospital procedures.

SQL Healthcare Result Set 3
| Number of Procedures | Number of Admissions |
|---|---|
| 0 | 46,652.00 |
| 1 | 20,742.00 |
| 2 | 12,717.00 |
| 3 | 9,443.00 |
| 6 | 4,954.00 |
| 4 | 4,180.00 |
| 5 | 3,078.00 |
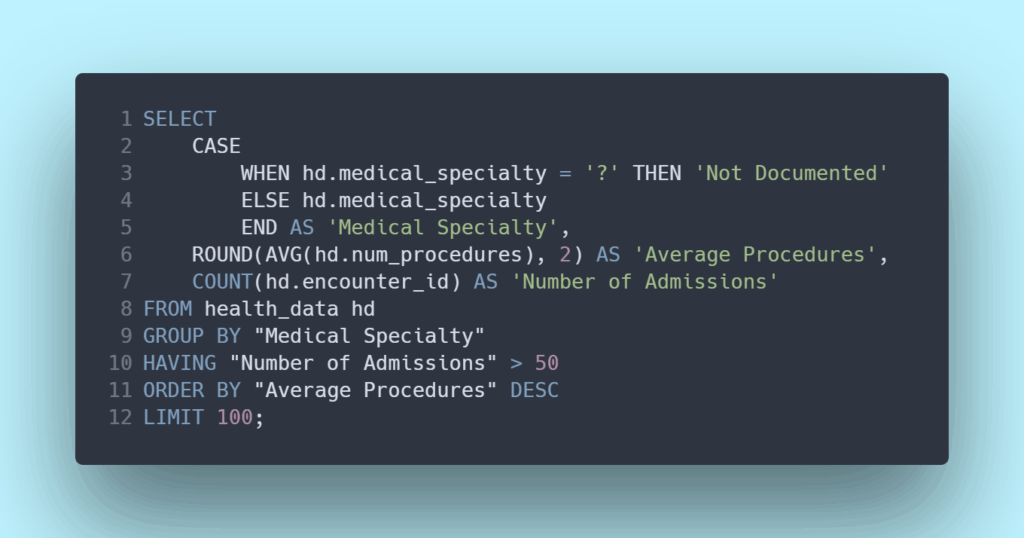
4) I also wanted to see what effect the type of procedure had on hospital admissions. Below is the average number of procedures grouped by the specialist that performed them, the top 5 specialties are highlighted. Here we don’t see a clear connection between the type of procedure and hospital admissions.
SQL Healthcare Result Set 4
| Medical Specialty | Average Procedures | Number of Admissions |
| Surgery-Thoracic | 3.50 | 109 |
| Surgery-Cardiovascular/Thoracic | 3.25 | 652 |
| Radiologist | 3.24 | 1,140 |
| Cardiology | 2.70 | 5,352 |
| Surgery-Vascular | 2.57 | 533 |
| Radiology | 2.53 | 53 |
| Podiatry | 2.40 | 100 |
| Surgery-Cardiovascular | 2.11 | 98 |
| Gynecology | 2.09 | 58 |
| Neurology | 2.07 | 203 |
| Surgery-Neuro | 1.94 | 468 |
| ObstetricsandGynecology | 1.93 | 671 |
| Orthopedics | 1.92 | 1,400 |
| Otolaryngology | 1.90 | 125 |
| Urology | 1.83 | 685 |
| Nephrology | 1.78 | 1,613 |
| Orthopedics-Reconstructive | 1.69 | 1,233 |
| Surgery-General | 1.65 | 3,099 |
| Hematology | 1.57 | 82 |
| Gastroenterology | 1.56 | 564 |
| Not Documented | 1.24 | 49,949 |
| Emergency/Trauma | 1.15 | 7,565 |
| Oncology | 1.10 | 348 |
| InternalMedicine | 1.02 | 14,635 |
| Pulmonology | 0.99 | 871 |
| Hematology/Oncology | 0.97 | 207 |
| Family/GeneralPractice | 0.97 | 7,440 |
| Hospitalist | 0.95 | 57 |
| Endocrinology | 0.88 | 120 |
| Pediatrics | 0.72 | 254 |
| PhysicalMedicineandRehabilitation | 0.69 | 391 |
| Psychiatry | 0.37 | 854 |
| Psychology | 0.26 | 101 |
| Pediatrics-CriticalCare | 0.06 | 87 |
| Pediatrics-Endocrinology | 0.01 | 159 |
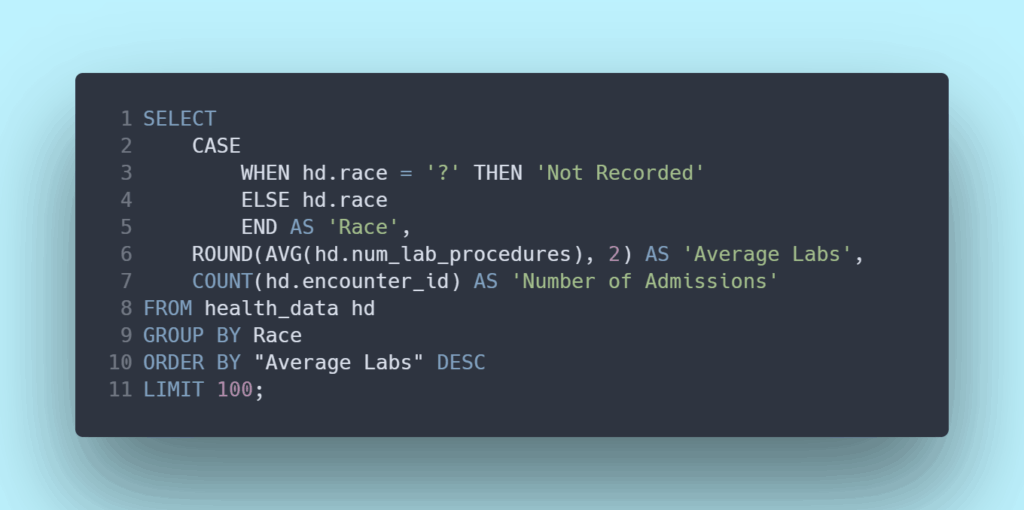
5) Next I wanted to explore how the number of Lab Procedures connect to different parts of the data. Below is the number of labs ordered for patients grouped by race. Note: Lab Procedures (blood tests, diagnostic imaging) is different from Procedures (surgeries) in this data set.
SQL Healthcare Result Set 5
| Race | Average Labs | Number of Admissions |
| Not Recorded | 44.10 | 2,273 |
| AfricanAmerican | 44.09 | 19,210 |
| Other | 43.44 | 1,506 |
| Caucasian | 42.83 | 76,099 |
| Hispanic | 42.79 | 2,037 |
| Asian | 41.21 | 641 |

6) After that I looked at the connection between the duration of hospital admissions and the number of lab procedures.
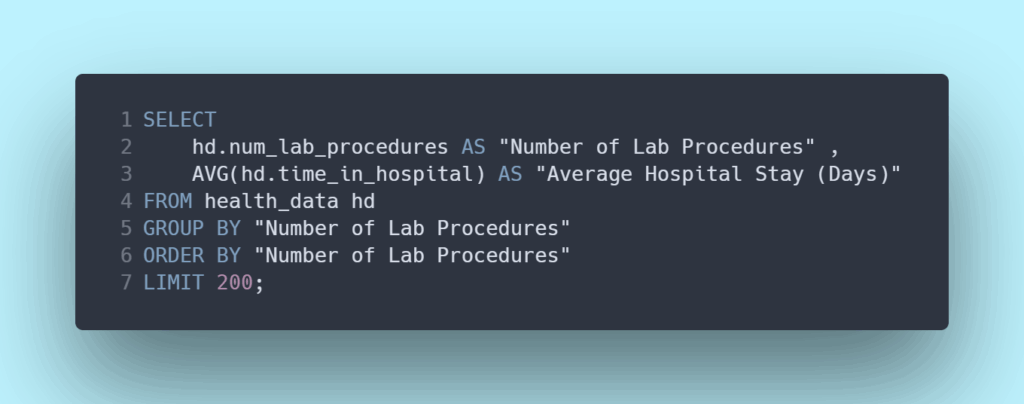
SQL Healthcare Result 6
| Number of Lab Procedures | Average Hospital Stay (Days) |
| 1 | 3.22 |
| 2 | 3.47 |
| 3 | 2.99 |
| 4 | 2.58 |
| 5 | 2.98 |
| 6 | 2.73 |
| 7 | 3.10 |
| 8 | 3.17 |
| 9 | 3.31 |
| 10 | 2.87 |
| 11 | 2.94 |
| 12 | 2.94 |
| 13 | 2.99 |
| 14 | 3.19 |
| 15 | 3.43 |
| 16 | 3.39 |
| 17 | 3.70 |
| 18 | 3.77 |
| 19 | 3.13 |
| 20 | 3.18 |
| 21 | 3.21 |
| 22 | 3.41 |
| 23 | 3.85 |
| 24 | 3.98 |
| 25 | 4.06 |
| 26 | 3.53 |
| 27 | 3.54 |
| 28 | 3.35 |
| 29 | 3.21 |
| 30 | 3.46 |
| 31 | 3.55 |
| 32 | 3.56 |
| 33 | 3.68 |
| 34 | 3.43 |
| 35 | 3.58 |
| 36 | 3.61 |
| 37 | 3.76 |
| 38 | 3.87 |
| 39 | 3.99 |
| 40 | 4.12 |
| 41 | 4.05 |
| 42 | 4.11 |
| 43 | 4.01 |
| 44 | 4.15 |
| 45 | 4.43 |
| 46 | 4.18 |
| 47 | 4.30 |
| 48 | 4.44 |
| 49 | 4.48 |
| 50 | 4.74 |
| 51 | 4.57 |
| 52 | 4.69 |
| 53 | 4.84 |
| 54 | 4.83 |
| 55 | 4.76 |
| 56 | 4.84 |
| 57 | 4.91 |
| 58 | 4.94 |
| 59 | 5.12 |
| 60 | 5.11 |
| 61 | 5.24 |
| 62 | 5.30 |
| 63 | 5.48 |
| 64 | 5.32 |
| 65 | 5.67 |
| 66 | 5.58 |
| 67 | 5.80 |
| 68 | 5.95 |
| 69 | 5.68 |
| 70 | 5.95 |
| 71 | 6.05 |
| 72 | 6.06 |
| 73 | 6.16 |
| 74 | 6.42 |
| 75 | 6.62 |
| 76 | 6.69 |
| 77 | 7.35 |
| 78 | 6.99 |
| 79 | 7.08 |
| 80 | 7.18 |
| 81 | 7.43 |
| 82 | 7.48 |
| 83 | 7.65 |
| 84 | 7.46 |
| 85 | 7.54 |
| 86 | 8.03 |
| 87 | 7.62 |
| 88 | 7.80 |
| 89 | 8.19 |
| 90 | 7.98 |
| 91 | 7.72 |
| 92 | 8.23 |
| 93 | 8.55 |
| 94 | 8.36 |
| 95 | 8.20 |
| 96 | 8.21 |
| 97 | 7.90 |
| 98 | 8.54 |
| 99 | 9.56 |
| 100 | 8.85 |
| 101 | 10.54 |
| 102 | 10.13 |
| 103 | 8.50 |
| 104 | 8.00 |
| 105 | 8.00 |
| 106 | 12.00 |
| 107 | 8.00 |
| 108 | 10.25 |
| 109 | 7.50 |
| 111 | 4.33 |
| 113 | 7.67 |
| 114 | 11.00 |
| 118 | 10.00 |
| 120 | 2.00 |
| 121 | 12.00 |
| 126 | 9.00 |
| 129 | 13.00 |
| 132 | 8.00 |
7) Since there was a large variety of lab procedures ordered for patients in this data set, I organized the number of lab procedures into 4 categories, then visualized how the categories of lab procedures are connected to the length of hospital admission.
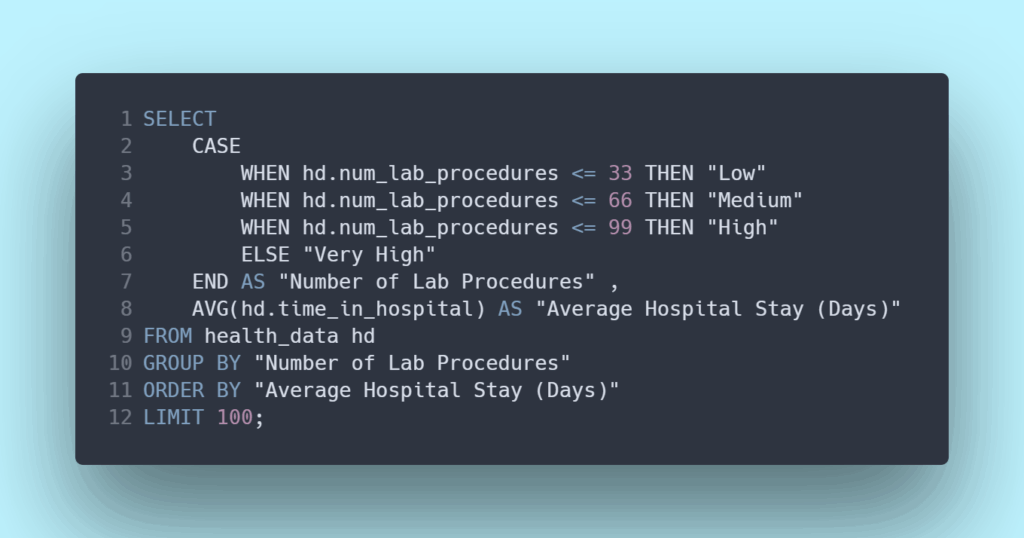
SQL Healthcare Result Set 7
| Number of Lab Procedures | Average Hospital Stay (Days) |
| Low | 3.38 days |
| Medium | 4.48 days |
| High | 6.49 days |
| Very High | 9.18 days |

8) After looking at the number of lab procedures I switched focus to A1C results. The A1C test measures the percentage of red blood cells in the body that are glycated (have sugar stuck onto them). A1C tests are often used to estimate the blood sugar of a patient for the past 3 months, and are a key tool for diagnosing diabetes.
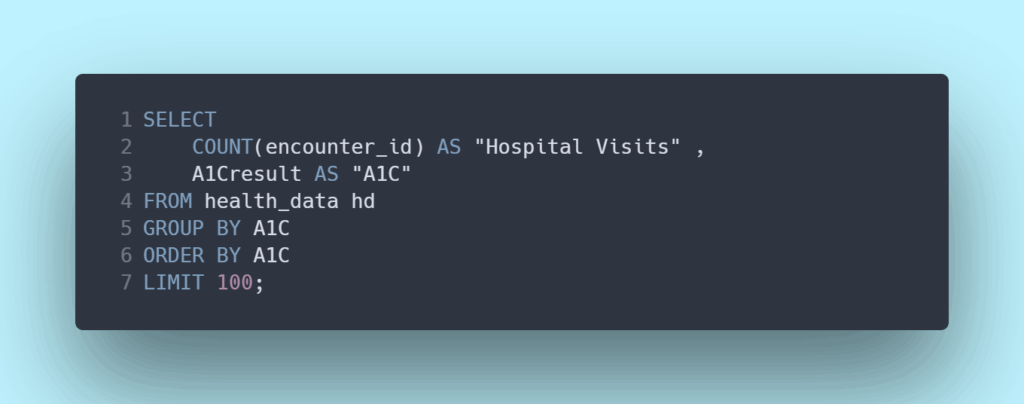
SQL Healthcare Result Set 8
| Hospital Visits | A1C |
| 7,624 | >7 |
| 16,432 | >8 |
| 169,496 | None |
| 9,980 | Normal |
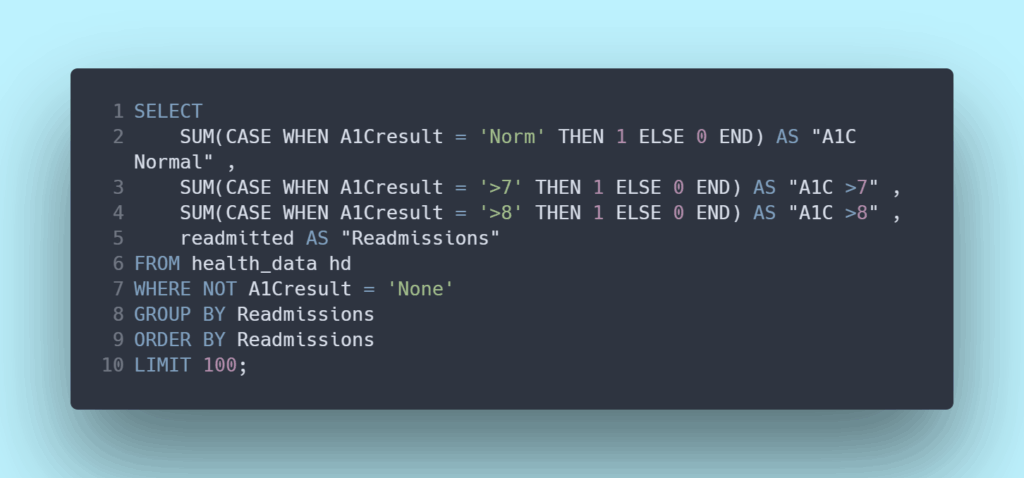
9) Here I visualize the A1C results of patients in the data set, grouped into readmission status. Along the x axis there are three groups
– Patients who were readmitted to the hospital less than 30 days after they were discharged
– Patients who were readmitted to the hospital more than 30 days after they were discharged
– Patients who were not readmitted after being discharged
We can see that for those patients that were readmitted to the hospital, patients with an A1C score of greater than 8 were readmitted more frequently than those with lower A1C scores.
SQL Healthcare Result Set 9
| A1C Normal | A1C >7 | A1C >8 | Readmissions |
| 964 | 766 | 1,622 | <30 days |
| 3,198 | 2,600 | 5,802 | >30 days |
| 5,818 | 4,258 | 9,008 | No Readmission |

10) Next I focused on another three metrics, number of medications prescribed to patients, number of lab tests ordered for patients, and the number of days in the hospital during an admission. I visualized the relationship all three of these metrics have with readmission rates, here again we see three categories of readmission
– Patients who were readmitted to the hospital less than 30 days after they were discharged
– Patients who were readmitted to the hospital more than 30 days after they were discharged
– Patients who were not readmitted after being discharged
In all three graphs below, patients who were readmitted less than 30 days after being discharged got more medicines prescribed, more lab tests ordered, and spent more time in the hospital during their initial admission.
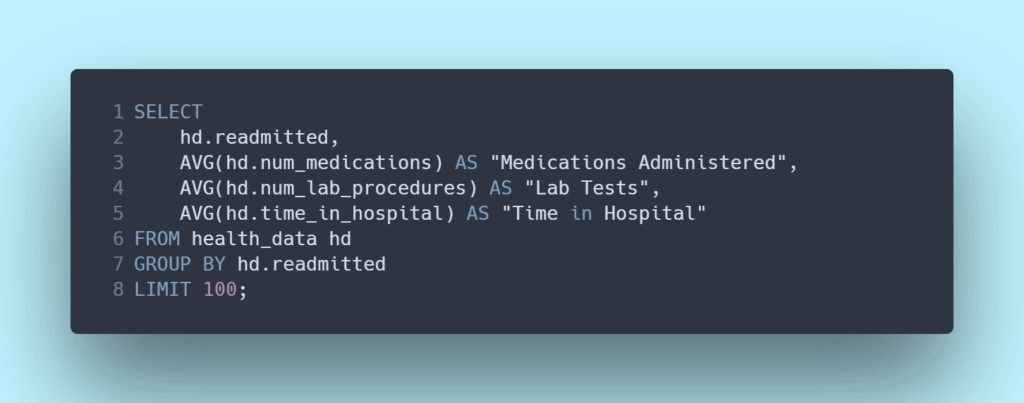
SQL Healthcare Result Set 10
| readmitted | Medications Administered | Lab Tests | Time in Hospital |
| <30 days | 16.903 | 44.226 | 4.768 |
| >30 days | 16.283 | 43.837 | 4.496 |
| No Readmission | 15.670 | 42.382 | 4.254 |


11) Since the data set provided each hospital admission encounter with a type, I decided to find the average number of days a patient spent in the hospital after being admitted through the Emergency Department.
I used multiple CTEs to calculate the average stay in the hospital, an “efficient” stay in the hospital which was less than the average, and the total number of patients admitted through the Emergency Dept.
I also added a column and manually calculated the number of “inefficient” hospital stays as the difference between the total admissions from the ED and the “efficient” admissions from the ED.
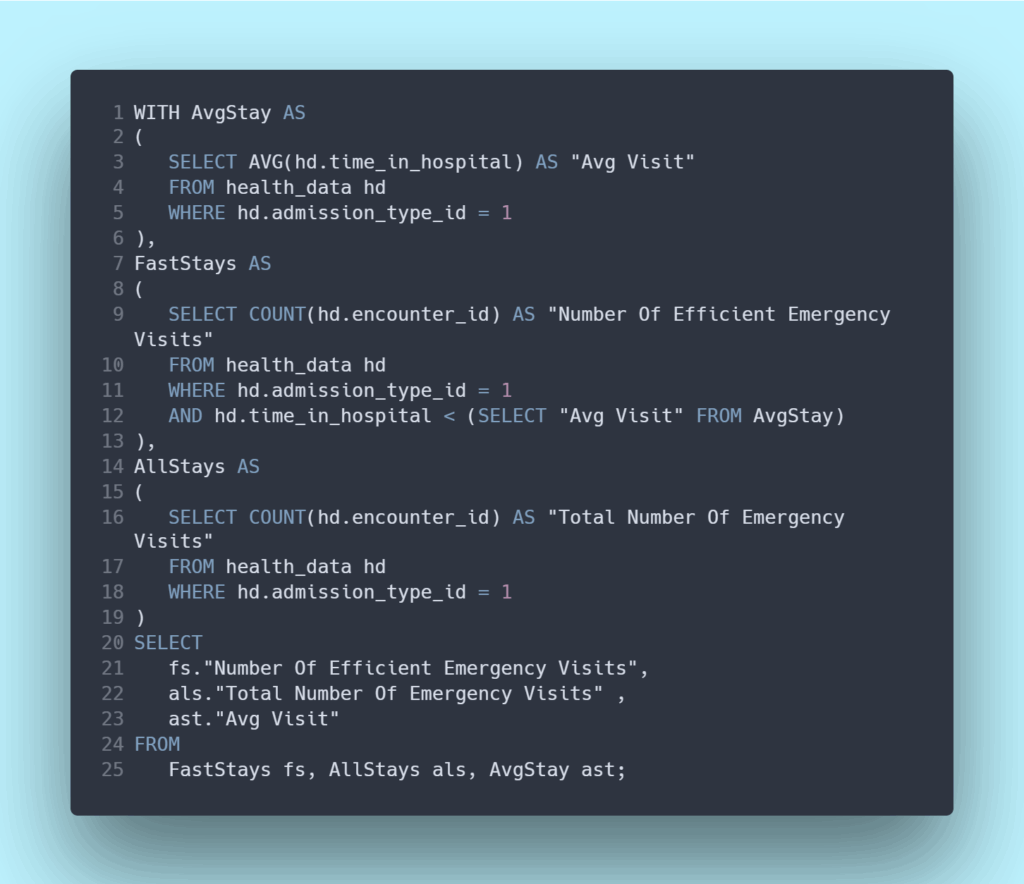
SQL Healthcare Result Set 11
| Number Of Efficient Emergency Visits | Number of Inefficient Emergency Visits | Total Number Of Emergency Visits | Avg Visit |
| 33,684 | 20,306 | 53,990 | 4.38 days |
12) After looking at the Emergency Dept I made use of the CONCAT function in SQL to build a text based summary of a patient based on information from multiple different sources in the data set. The result included the patient’s race, number of medications administered, number of labs ordered, and readmission status.
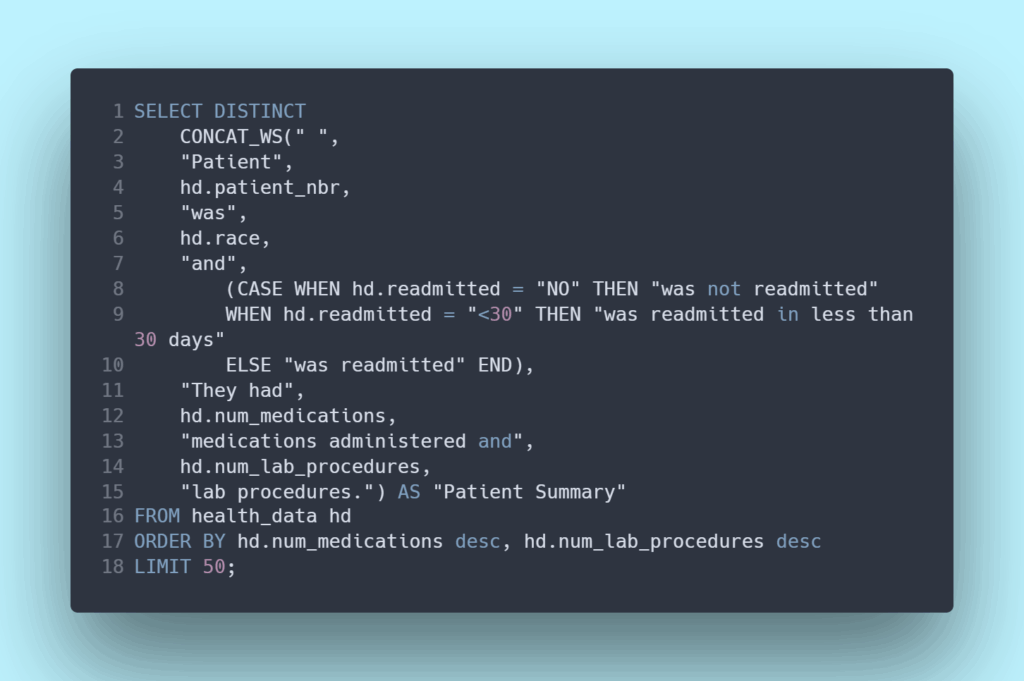
SQL Healthcare Result Set 12
| Patient Summary |
| Patient 24189597 was Caucasian and was readmitted in less than 30 days They had 81 medications administered and 57 lab procedures. |
| Patient 25112691 was Caucasian and was not readmitted They had 79 medications administered and 57 lab procedures. |
| Patient 43503210 was Caucasian and was not readmitted They had 75 medications administered and 76 lab procedures. |
| Patient 24526629 was Caucasian and was not readmitted They had 75 medications administered and 61 lab procedures. |
| Patient 25450911 was Caucasian and was not readmitted They had 74 medications administered and 62 lab procedures. |
| Patient 42147990 was Caucasian and was readmitted in less than 30 days They had 72 medications administered and 85 lab procedures. |
| Patient 42522309 was Caucasian and was readmitted in less than 30 days They had 72 medications administered and 73 lab procedures. |
| Patient 43515927 was Caucasian and was readmitted in less than 30 days They had 72 medications administered and 68 lab procedures. |
| Patient 25162767 was AfricanAmerican and was readmitted in less than 30 days They had 70 medications administered and 59 lab procedures. |
| Patient 23581485 was Caucasian and was readmitted They had 70 medications administered and 52 lab procedures. |
| Patient 23233167 was Caucasian and was readmitted They had 69 medications administered and 59 lab procedures. |
| Patient 24420438 was Caucasian and was readmitted They had 69 medications administered and 57 lab procedures. |
| Patient 24218658 was Caucasian and was readmitted They had 69 medications administered and 51 lab procedures. |
| Patient 23237658 was Caucasian and was readmitted They had 69 medications administered and 51 lab procedures. |
| Patient 24686586 was AfricanAmerican and was not readmitted They had 69 medications administered and 47 lab procedures. |
| Patient 41720949 was Caucasian and was readmitted in less than 30 days They had 68 medications administered and 88 lab procedures. |
| Patient 41931207 was Caucasian and was not readmitted They had 68 medications administered and 85 lab procedures. |
| Patient 43589439 was Caucasian and was readmitted They had 68 medications administered and 76 lab procedures. |
| Patient 23460264 was Caucasian and was readmitted They had 68 medications administered and 61 lab procedures. |
| Patient 24633099 was AfricanAmerican and was not readmitted They had 68 medications administered and 60 lab procedures. |
| Patient 23283081 was Caucasian and was readmitted in less than 30 days They had 68 medications administered and 55 lab procedures. |
| Patient 25027281 was Caucasian and was not readmitted They had 68 medications administered and 55 lab procedures. |
| Patient 40956858 was Caucasian and was readmitted They had 67 medications administered and 80 lab procedures. |
| Patient 44517078 was Caucasian and was readmitted in less than 30 days They had 67 medications administered and 70 lab procedures. |
| Patient 24177357 was AfricanAmerican and was not readmitted They had 67 medications administered and 64 lab procedures. |
| Patient 25027083 was AfricanAmerican and was not readmitted They had 67 medications administered and 59 lab procedures. |
| Patient 23638617 was Caucasian and was readmitted They had 67 medications administered and 53 lab procedures. |
| Patient 23438790 was Caucasian and was readmitted in less than 30 days They had 67 medications administered and 52 lab procedures. |
| Patient 24571170 was AfricanAmerican and was readmitted They had 67 medications administered and 51 lab procedures. |
| Patient 75419874 was Caucasian and was not readmitted They had 66 medications administered and 98 lab procedures. |
| Patient 40844394 was Caucasian and was not readmitted They had 66 medications administered and 77 lab procedures. |
| Patient 40948776 was Caucasian and was not readmitted They had 66 medications administered and 71 lab procedures. |
| Patient 23834763 was Caucasian and was not readmitted They had 66 medications administered and 64 lab procedures. |
| Patient 24810210 was AfricanAmerican and was not readmitted They had 66 medications administered and 50 lab procedures. |
| Patient 41572197 was Caucasian and was not readmitted They had 65 medications administered and 86 lab procedures. |
| Patient 175326800 was Caucasian and was not readmitted They had 65 medications administered and 77 lab procedures. |
| Patient 25119549 was AfricanAmerican and was not readmitted They had 65 medications administered and 65 lab procedures. |
| Patient 23698971 was AfricanAmerican and was not readmitted They had 65 medications administered and 62 lab procedures. |
| Patient 34584417 was Caucasian and was readmitted They had 65 medications administered and 62 lab procedures. |
| Patient 25030917 was Caucasian and was not readmitted They had 65 medications administered and 61 lab procedures. |
| Patient 23317785 was AfricanAmerican and was readmitted They had 65 medications administered and 60 lab procedures. |
| Patient 25469595 was Caucasian and was not readmitted They had 65 medications administered and 60 lab procedures. |
| Patient 24936732 was Caucasian and was not readmitted They had 65 medications administered and 59 lab procedures. |
| Patient 23469318 was AfricanAmerican and was not readmitted They had 65 medications administered and 56 lab procedures. |
| Patient 24848964 was AfricanAmerican and was not readmitted They had 65 medications administered and 51 lab procedures. |
| Patient 23302566 was AfricanAmerican and was not readmitted They had 65 medications administered and 47 lab procedures. |
| Patient 40371588 was Caucasian and was readmitted They had 64 medications administered and 76 lab procedures. |
| Patient 45780282 was Caucasian and was not readmitted They had 64 medications administered and 75 lab procedures. |
| Patient 43919676 was Caucasian and was not readmitted They had 64 medications administered and 75 lab procedures. |
| Patient 42161742 was Caucasian and was readmitted in less than 30 days They had 64 medications administered and 74 lab procedures. |
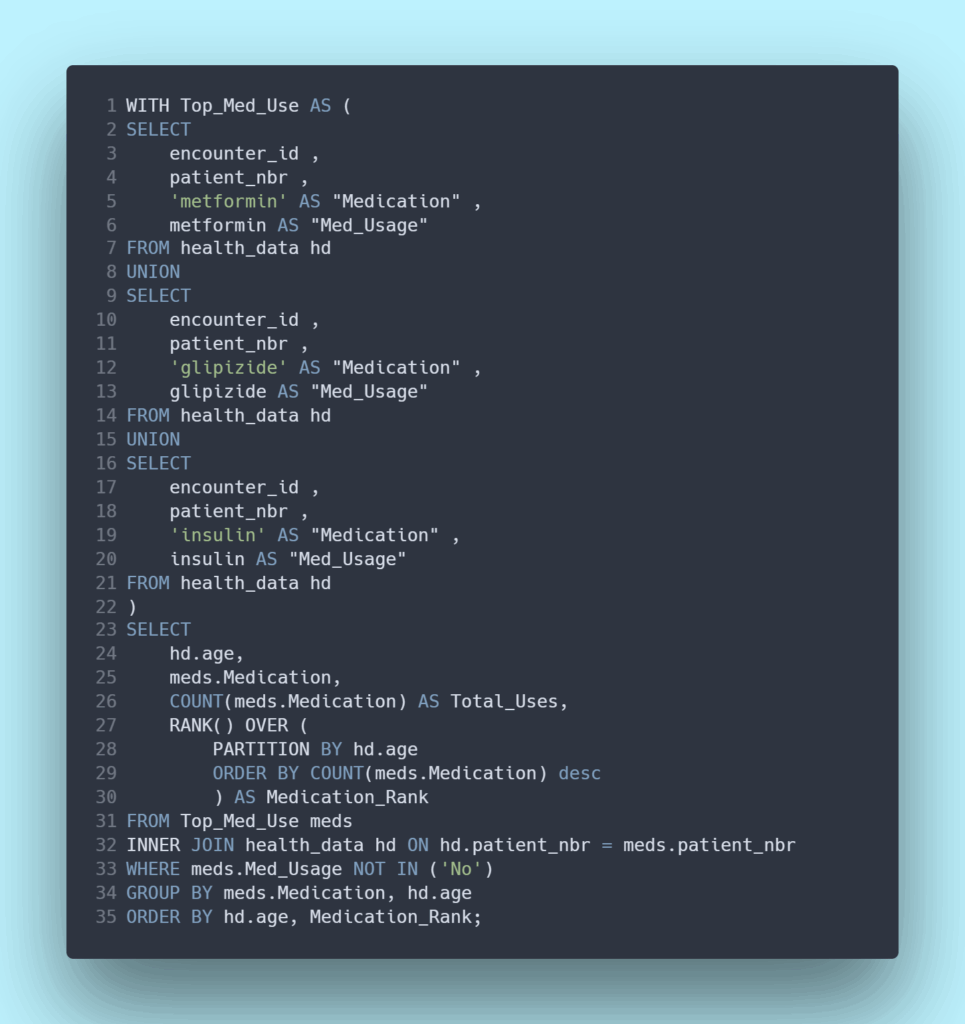
13) There was one last question I wanted to answer with this analysis: How often were the top 3 most common medications prescribed to patients? The top 3 most common prescribed medications in this data set were all drugs that are designed to help manage Type II Diabetes, Insulin, Glipizide, and Metformin.
The query below first uses the UNION command to rearrange data originally in a wide format to a long format and places that reorganized data into a CTE. I then used the RANK window function to rank the 3 medications based on how many times they were prescribed. I grouped the result by age group to see if there was any difference in prescription frequency across age groups.
As the result set shows, the three medications were prescribed with the same frequency across age groups. Insulin is the most commonly prescribed with a rank of 1 for each age group, and then Metformin, and then Glipizide.
SQL Healthcare Result Set 13
| age | Medication | Total_Uses | Medication_Rank |
| [0-10) | insulin | 143 | 1 |
| [10-20) | insulin | 1,326 | 1 |
| [10-20) | metformin | 68 | 2 |
| [10-20) | glipizide | 3 | 3 |
| [20-30) | insulin | 5,675 | 1 |
| [20-30) | metformin | 255 | 2 |
| [20-30) | glipizide | 117 | 3 |
| [30-40) | insulin | 6,370 | 1 |
| [30-40) | metformin | 1,633 | 2 |
| [30-40) | glipizide | 627 | 3 |
| [40-50) | insulin | 15,246 | 1 |
| [40-50) | metformin | 4,978 | 2 |
| [40-50) | glipizide | 2,351 | 3 |
| [50-60) | insulin | 22,160 | 1 |
| [50-60) | metformin | 7,946 | 2 |
| [50-60) | glipizide | 4,469 | 3 |
| [60-70) | insulin | 28,383 | 1 |
| [60-70) | metformin | 9,885 | 2 |
| [60-70) | glipizide | 6,564 | 3 |
| [70-80) | insulin | 30,448 | 1 |
| [70-80) | metformin | 9,766 | 2 |
| [70-80) | glipizide | 7,538 | 3 |
| [80-90) | insulin | 19,437 | 1 |
| [80-90) | glipizide | 5,038 | 2 |
| [80-90) | metformin | 4,663 | 3 |
| [90-100) | insulin | 2,954 | 1 |
| [90-100) | glipizide | 749 | 2 |
| [90-100) | metformin | 483 | 3 |